
 This is a subscriber-only article
 It looks like you're browsing in private mode


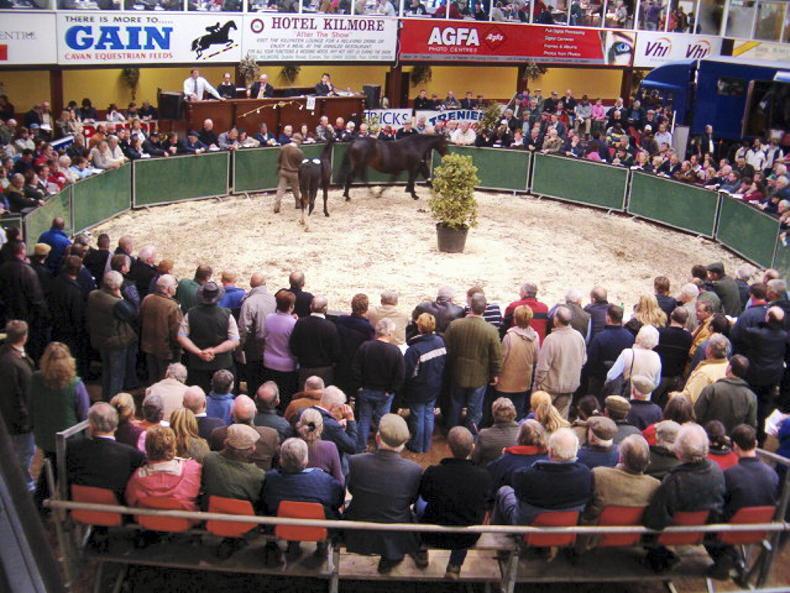


OVERALL 2022 was a positive year in the public auction rings, however, most particularly in the three-year-old division, there were some market contraction signals, while in the foal category, filly foals also showed some downward movement in average prices. Although the analysis of public auctions is useful as a barometer of trade, it is not a ‘full picture’ analysis given the majority of ‘sport horse’ trade is in the private domain.
The sport horse sales returns reviewed include Cavan Equestrian (CEC), Goresbridge Horse Sales (GB) (including Supreme Foal Sale and Go for Gold), Mullingar Equestrian Horse Sales (ME), Monart Sale of Eventers (MSE), and Irish Horse Centre (IHC) sales. Returns from auctions at Boleybawn Horses (BH) and Ballypatrick Auctions (GBBS) were included in some of the analysis figures. Irish Draught and Connemara/other pony sales are not included.
(Notes: 1k represents 1,000. Ave = Average. Outliers were allocated as uppermost top prices separated by greater than €2,000- €2,500 from those below.)

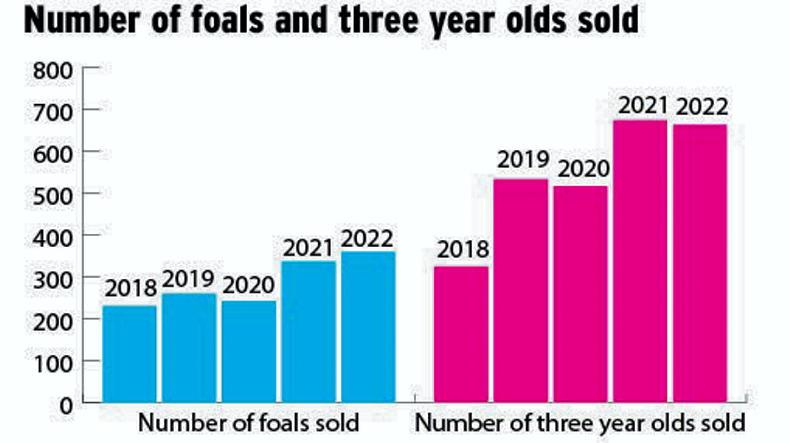
Graph 1: The number of foals and three-year-olds sold across all public auctions in 2022 remained very similar to numbers sold in 2021.
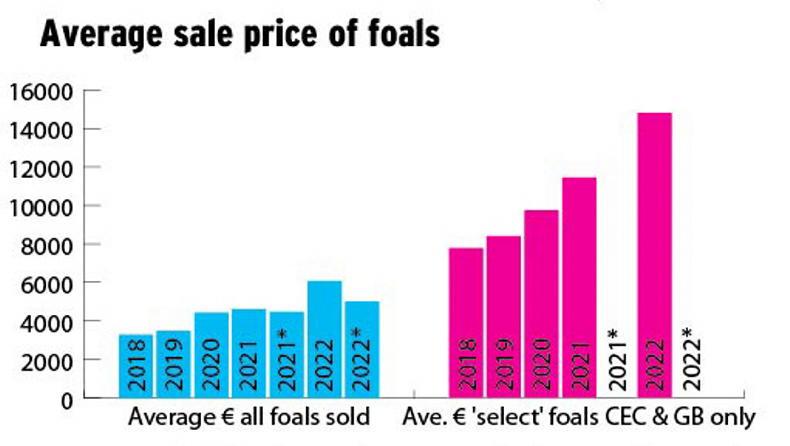
Graph 2: Average sale price of foals
Graph 2: Average sale price of ‘all foals’ when all auctions are included demonstrated a 32% increase in 2022 over 2021, and up 36.2% on 2018. When the BH and GBBS auctions are omitted, the average sales price 2022* is 12% improved on 2021*. The overall trend is positive when comparing average returns for foals. The five-year trend for average sales price (minus BH & GBBS auctions) is 52.8% improved since 2018. However, costs of production have also been rising during this time.
Average sales price achieved by foals sold at Cavan Elite Sale and Goresbridge Supreme Foal Sale combined demonstrates a 29.5% improvement on comparable 2021 figures, 90% higher than 2018.

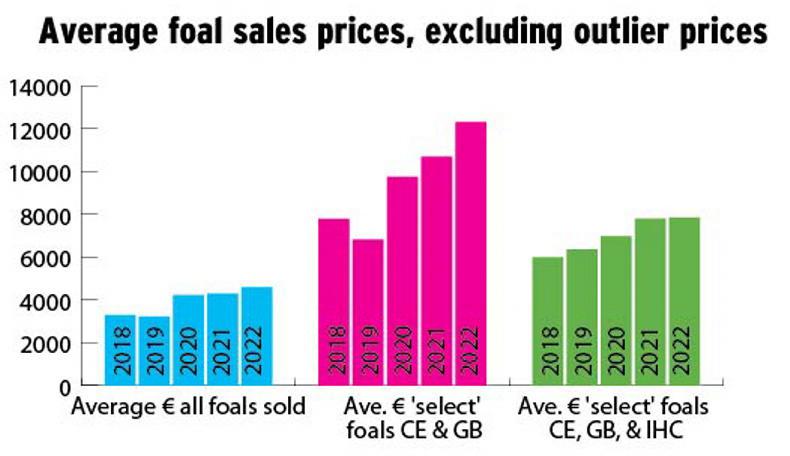
Graph 3: Average foal sales prices, excluding outlier prices
Graph 3: Having removed outliers the following was evident: 7.2% increase in return of average for ‘all’ foals in 2022 over 2021 and 40% improvement in 2022 over 2018. A 15% higher price achieved for ‘select foals’ at Cavan and Goresbridge over 2021 select foal price average and a 58.2% rise since 2018. Negligible change, 0.07% increase, in 2022 price attained for ‘select’ foals sold at Cavan, Goresbridge, and via Irish Horse Centre over 2021, with a 31% increase since 2018

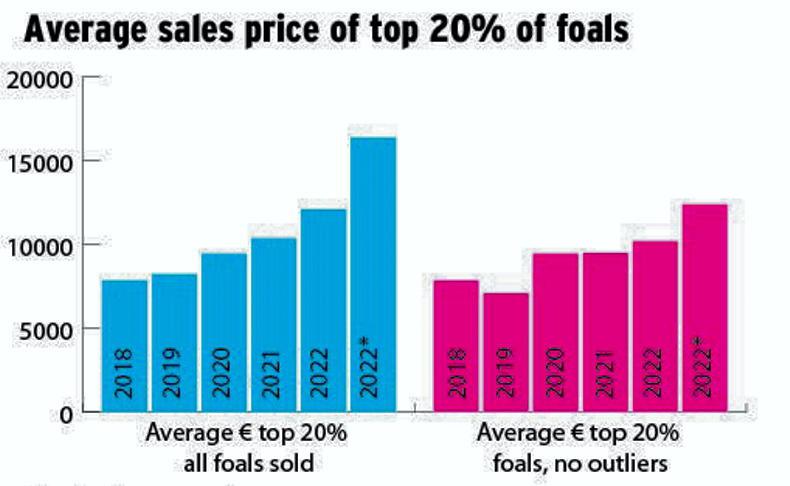
Graph 4: Average sales price of top 20% of foals
Graph 4: The ‘top 20%’ of ‘all foals’ foals sold in 2022 (across all auctions) commanded an average price 168% higher than the average for ‘all foals’ in 2022; while the comparable differential is closer to 140% higher price for the ‘top 20%’ average when the BH and GBBS auctions are excluded.
Omitting BH and GBBS auctions in both groups the 2022 average price of ‘top 20%’ excluding outliers outweighs that of the average excluding outliers for ‘all foals’ by 121.3%. The average of the 2022 ‘top 20%’ excluding outliers (no BH/GBBS figures included) is 7.4% improved on the 2021 ‘top 20%’ average excluding outliers; and 29.7% ahead of 2018 comparable returns.
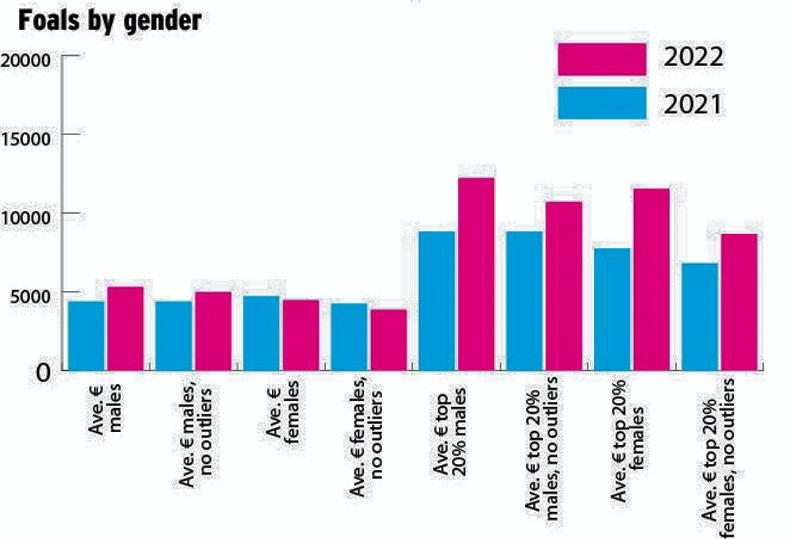
Graph 5: Foals by gender
Colts again outperformed fillies both in numbers sold and averages achieved. 201 colts sold for an average of €5,304 (21.2% improved on 2021), while 127 fillies achieved an average of €4,456 (down 5.5% on 2021). When colt outliers 26k, 26k and 31k are removed, the average is €4,975 (up 13.7% on 2021) and when filly outliers (22k; 30k and 36k in 2022; and 35k x 2 in 2021) are removed the average is €3,854 (down 9.9% on 2021).
The ‘top 20%’ of colt foals sold for average €12,203, up 38.3% on 2021 (€10,682 when outliers are removed, up 21% on 2021) and ‘top 20%’ of fillies for average €11,526, up 45.4% on 2021, (€8,670 when outliers are removed, up 27.8% on 2021). Only two were catalogued without gender included.
Three-year-olds
The ‘select’ auctions evaluated in this age group include Cavan Premier Sale; Goresbridge Select Sale of Eventers and Jumpers; Goresbridge Go For Gold Eventers, Goresbridge October Select Sale, Monart Select Auction, and Irish Horse Centre.
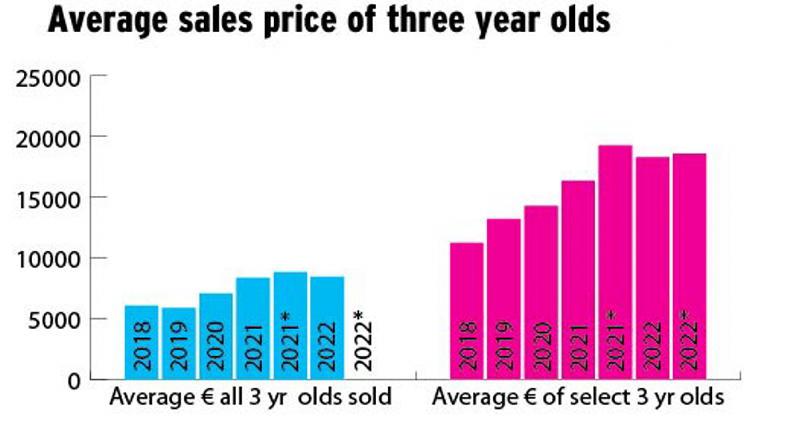
Graph 6: Average sales price of three year olds
Graph 6: While the average for ‘all three-year-olds’ sold in 2022* has risen 39.7% since 2018 (up 68.8% since 2017), the 2022* average is on a par with 2021 (just 1.1% higher). Including the six GBBS three-year-olds sold the differential is 5.4% higher in 2022 over 2021, and 45.7% higher than 2018. In total, 182 three-year-olds were reported sold across all select auctions analysed.
Select Auctions: Including all ‘select’ auctions the average performed with a 118.6% improvement compared to that of ‘all three -year-olds’ 2022 and outperformed ‘non-select’ three-year-olds by 297.4%. The average is also 17.8% up on price of 2021 ‘select’ three-year-olds and 71.4% improved on those sold in 2018.
Omitting the six sold via GBBS Auction the average price is 116.3% improved on the comparable group of ‘all three-year-olds’; 11.8% up on 2021 and 62.6% higher than the 2018 ‘select’ three-year-old average. Minus the five sold via IHC and six at GBBS auctions the average is 121.8% improved on the reciprocal group of ‘all three-year-olds’; 14.6% up on 2021 and 66.8% higher than the 2018 ‘select’ three-year-olds average.
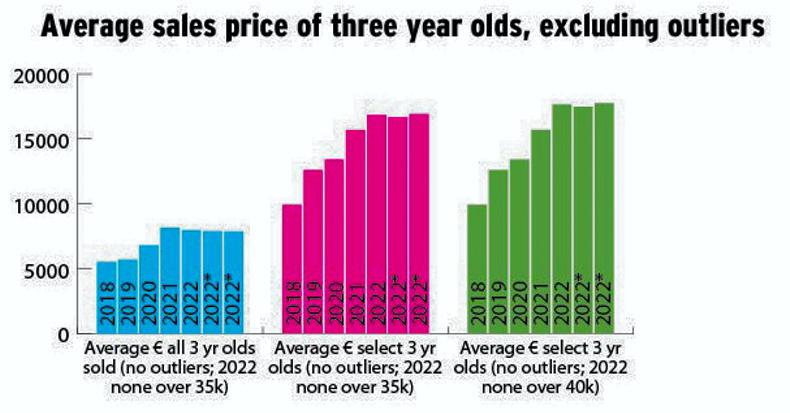
Graph 7: Average sales price of three year olds, excluding outliers
Graph 7: When outliers over 35k are excluded, there is little difference (€78) between the three variations reviewed under average of ‘all’ three-year-olds. The same can be said within the ‘select’ category with a difference in the 2022 average of just €259 when excl. € over 35k; €274 when excl. € over 40k whether including all auctions or excluding IHC and GBBS from the analysis.
When comparing, while omitting ‘€ over 35k’, the average of select candidates across all sales with ‘all three year olds’ the average is 111.7% greater; and when comparing against all ‘non-select three-year-olds’ the average is 247.5% higher illustrating the performance of these auctions in terms of reported returns. Comparing to 2021 returns, the select group, less outliers over 35k, the average grew by 7.5% while the comparison to 2018 shows a 69.95% advantage.
The graph excluding outliers over 40k in 2022 is included to demonstrate there is little difference whether using the criteria of prices separated by greater than 2k from those below (14 horses removed), or in choosing the higher break point of 40k (eight horses removed).

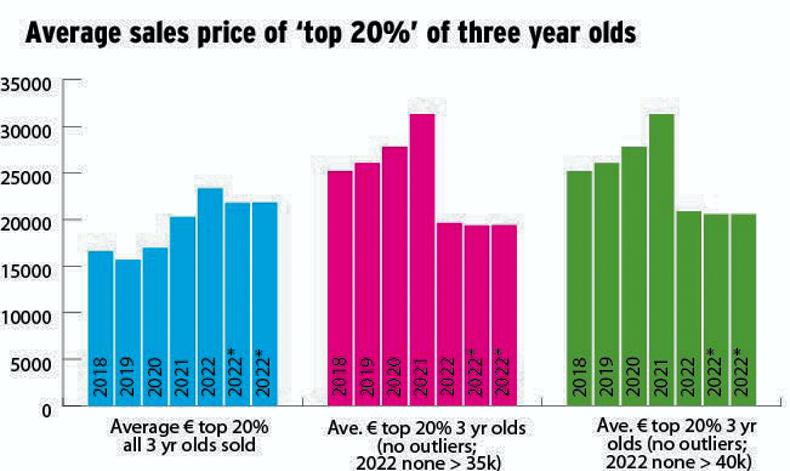
Graph 8: Average sales price of ‘top 20%’ of three year olds
Graph 8: Including all sales, the average price of ‘top 20%’ of ‘all three-year-olds’ sold in 2022 was 164.6% higher than that of ‘all three-year-olds’ sold in 2022; 15% improved on average of ‘top 20%’ 2021; and 40.6% more than the ‘top 20%’ average in 2018. Not including GBBS figures, the average price of ‘top 20%’ of ‘all three-year-olds’ sold in 2022 was 157.4% higher than that of ‘all three-year-olds’ sold in 2022; 7.3% improved on average of ‘top 20%’ 2021; and 31.2% more than the’ top 20%’ average in 2018.
2022 All sales: With outliers over 35k removed, 2022 average for the ‘top 20% of three-year-olds’ was 59.6% back on 2021 top 20% average excluding outliers; and with outliers over 40k removed for 2022, the average was 49.9% back on 2021 ‘top 20%’ average. This is perhaps evidence of a tightening in the market whereby the outliers at the very top end distorted the average significantly. Comparing to 2018 figures with outliers over 35k removed the 2022 average is 28.4% down on the 2018 average minus outliers for the top 20%; and with outliers over 40k removed the 2022 average is 29.8% down on the 2018 figure.
2022* No GB/ IHC: With outliers over 35k removed 2022 average for the ‘top 20% of three-year-olds’ was 61.4% back on 2021 ‘top 20%’ average excluding outliers; and with outliers over 40k removed for 2022 the average was 52.3% back on 2021 ‘top 20%’ average, also demonstrating market contraction. Comparing to 2018 figures with outliers over 35k removed, the 2022 average is 20.5% down on the 2018 average minus outliers for the top 20%; and with outliers over 40k removed, the 2022 average is 22.5% down on the 2018 figure.
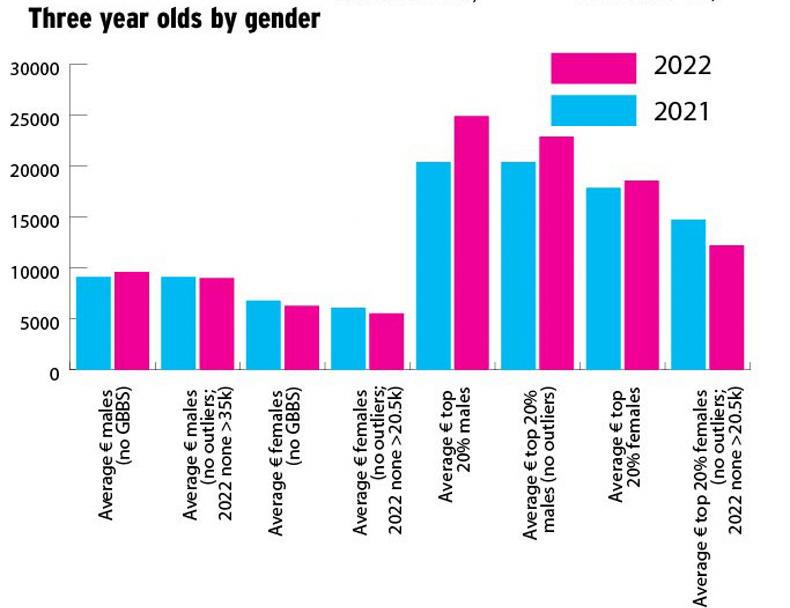
Graph 9: Three year olds by gender
Graph 9: Male three-year-olds outperformed females both in numbers sold and averages achieved. 426 (not incl. GBBS) /429 (all auctions) males sold for an average of €9,622 and €9,809 respectively. When outliers over 35k (all sales) are removed, the male average is €9.026. When outliers over 40k (all sales) are removed, male average is €9.809.
While 230 (not incl. GBBS) /233 (all auctions) females sold for an average €6,291 and €6,987 respectively. When outliers over 20.5k (all sales) are removed, fillies average is €5,565. When only outliers over 40k (all sales) are removed, fillies average is €6,291.
The ‘top 20%’ male average reached €24,912, or €22,894 excluding outliers over 40k. The ‘top 20%’ female average was €18,594, or €12,242 excluding outliers over 20.5k and €15,433 excluding only outliers over 40k.
In summary
Foals outperformed three-year-olds in the sense of degree of growth in the average compared to 2021. The ‘all foals, all auctions’ average was up 32% over 2021; while ‘all three year olds, all auctions’ average grew 5.4% in comparison; ‘foals (no BH/GBBS/IHC)’ average increased by 7.2% on 2021, whereas ‘three year olds (no GBBS)’ improved by 1.1%. However, the growth in ‘top 20% of foals (no BH/GBBS and no outliers)’ at 7.4% was on a par with that of 7.3% increase in ‘top 20% three year olds (no GBBS)’average. The filly foal average both ‘with’ and ‘without outliers’ suffered in contrast to that of colts, yet, when focusing on the ‘top 20%’ of fillies versus colts in terms of growth over 2021 averages, the fillies ‘with’ or ‘without outliers’ outperformed colts by 7.1% (with) or 6.8% (without) outliers.
Although an overall analysis of average prices achieved for three year olds conveys a positive performance, the contraction in average price of those in the top 20% of reported returns, when the outlier prices are removed from the analysis, suggests a change in climate.
These figures are not just significantly lower than the 2021 performance, back 50-60% depending on outlier values used, but contracted on 2018 returns also by as much as 20-30%.

SHARING OPTIONS: